- Broward County Public Schools
- About Us
About Us
-

RATED school district

FIRST fully accredited school
system in Florida since 1962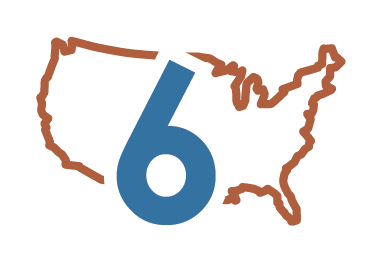
SIXTH largest school
system in the U.S.
$128 MILLION*
earned in scholarships
*Total scholarships for the Class of 2024, including self-reported and Bright Futures.
Our Programs
-
Athletics: 74 programs offered at middle and high schools
#BrowardCODES: First district to partner with national Code.org initiative
Broward Technical Colleges: Students at our Technical Colleges - Atlantic, McFatter, and Sheridan - led the state of Florida in total certifications earned for a seventh consecutive year
Broward Virtual School: A pioneer in virtual learning, celebrating 20+ years of e-Learning leadership
Cambridge International: BCPS named District of the Year by Cambridge International twice in four years (2017/18 and 2020/21) for high academic achievements among students in Cambridge programs
Chess: Largest school district to offer scholastic chess to all second grade students; all K – 12 students have access to Chess4Life, an interactive online chess platform
Computer Science: Courses, curriculum and activities at every school
CTACE: BCPS provides 75+ Career Technical Education paths across high and middle schools, technical colleges, and alternative education centers, preparing students for high-paying jobs
Debate: Largest in the nation, with more than 15,000 students actively competing
Dual Language: Offered at 41 schools
Foreign Exchange: For BCPS and international students between ages 15 – 18
Innovative and Magnet Programs: Total: 188 magnet and innovative programs
JROTC: Largest program in the nation
Top High Schools: Thirteen BCPS High Schools were ranked in the top 25% of high schools in the nation by U.S. News and World Report for 2024, and seven schools were ranked in the top 10% of high schools in Florida.
Our Staff
-
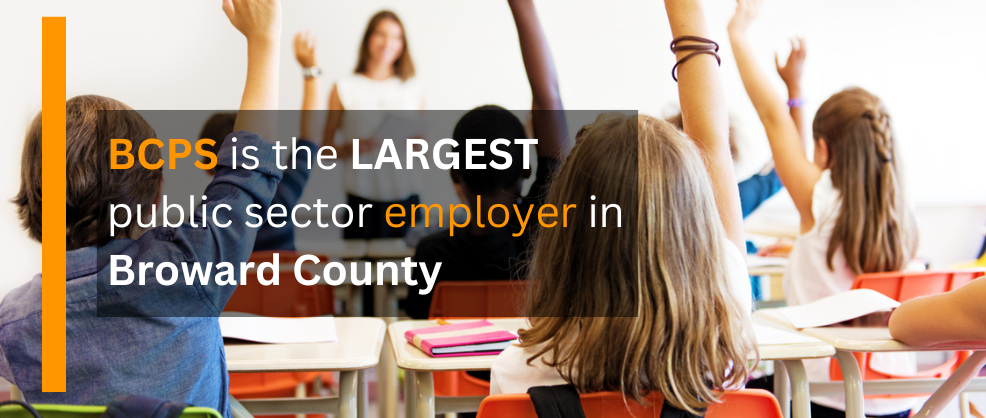
Total instructional staff: 14,479
Clerical and support staff: 10,170
Administrators: 1,617Total number of permanent employees: 26,266
Substitute teachers and temporary employees: 2.041
Substitute teachers and temporary employees outsourced through Kelly Education Services: 3,165Total employees: 31,472
Source: Enterprise Applications, as of 08/15/2024.
Our Students
-
Demographics
White: 51.1% / 126,512
Black: 40.8% / 101,055
Asian: 3.9% / 9,554
Native American or Native Alaskan: 0.3% / 757
Native Hawaiian or Pacific Islander: 0.2% / 505
Multiracial: 3.7% / 9,118
Hispanic: 39.0% / 96,417
Non-Hispanic: 61.0% / 151,084
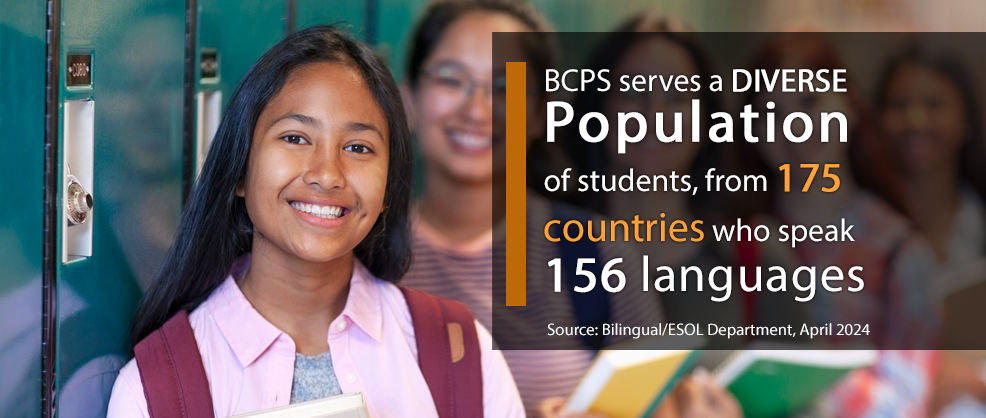
English Language Learners (ELL): 15.0% / 37,178
Exceptional Student Education (ESE): 16.2% / 40,105
Free or Reduced Lunch Meals: 62.3% / 154,089
Source: 09/09/2024 Benchmark Day Enrollment Report, Demographics & Enrollment Planning -
Adult Education
BCPS educates approximately 125,000 adult learners. Adult education is provided at:3 Technical Colleges-
Atlantic Technical
-
McFatter Technical
-
Sheridan Technical
Community Schools (North & South)-
Located in 33 satellite locations across Broward
Non-Traditional Schools-
Dave Thomas
-
H. D. Perry
-
Whiddon-Rogers
-
Seagull
-
Whispering Pines
-
-
Average Expenditures Per Student
Basic Programs: $8,728
ESOL: $9,169
Exceptional Programs: $15,914
Career Education: $7,848
Total For All Programs: $10,389
Source: 2023-24 Average Per Student Expenditure, Florida Department of Education
-
Attendance
90.7% Overall Average Daily Attendance
Source: Student Attendance 2022/23 Report Research, Evaluation & Accountability, updated as of October 2023
-
Enrollment
Pre – K: 5,554
K – 5: 80,319
6 – 8: 40,527
9 – 12: 67,583
Centers: 3,851
Charter Schools: 49,667
TOTAL: 247,501
Source: 09/09/2024 Benchmark Day Enrollment Report, Demographics & Enrollment Planning
-
Graduation Rate
96.2%*
*Traditional high schools 2023/24 (Excludes Centers and Charter Schools)
Source: High School Graduation Rates, 2023-2024 -
Promotion Rate
Our Schools
-
Number of Schools
Elementary: 137Middle: 35
High: 32
Combination: 9
Colleges (Adult Enrolled): 3
Centers: 16
ESE Contract Agency Schools: 7
TOTAL: 239
Charter Schools: 88
Total Schools: 327
Source: Demographics & Enrollment Planning, 2024/25 School Year. -
Transportation
830+ school buses transport more than 54,000 students daily, and BCPS buses travel more than 10.7 million miles annually.
Source: Student Transportation and Fleet Services, as of July 2023.
School Grades Breakdown
-
Elementary Schools
A: 55
B: 39
C: 43
D: 0
F: 0
Source: 2024-25 School Grades, Florida Department of Education as of July 24, 2024
-
Middle Schools
A: 12
B: 6
C: 17
D: 0
F: 0
Source: 2024-25 School Grades, Florida Department of Education as of July 24, 2024
-
High Schools
A: 12
B: 14
C: 6
D: 0
F: 0
Source: 2024-25 School Grades, Florida Department of Education as of July 24, 2024
-
Combination Schools
A: 3
B: 3
C: 3
D: 0
F: 0
Combination schools include grades K – 8 or 6 – 12.
BCPS centers and colleges do not receive letter grades from the state.Source: 2024-25 School Grades, Florida Department of Education as of July 24, 2024
Public Charter School Grades
-
Elementary Schools
A: 12
B: 4
C: 9
D: 1
F: 0
Source: 2024-25 School Grades, Florida Department of Education as of July 24, 2024
-
Middle Schools
A: 8
B: 2
C: 4
D: 0
F: 0
Source: 2024-25 School Grades, Florida Department of Education as of July 24, 2024
-
High Schools
A: 2
B: 3
C: 2
D: 0
F: 0
Source: 2024-25 School Grades, Florida Department of Education as of July 24, 2024
-
Combination Schools
A: 20
B: 7
C: 4
D: 0
F: 0
Combination schools include grades K-8 or 6-12
BCPS centers and colleges do not receive letter grades from the stateSource: 2024-25 School Grades, Florida Department of Education as of July 24, 2024


