- Broward County Public Schools
- Maps
- GIS for School Planning
Maps and Data
Page Navigation
GIS for School Planning
-
Geographic Information Systems (GIS) enables school districts the ability to make more effective and efficient decisions regarding planning.
School superintendents do many kinds of work, including:
- Communicating with school board members, parents and students about changes, contentious issues and district policies
- Helping form community attitudes and opinions
- Analyzing decisions about service delivery and costs
- Negotiating agreements with city, county and state officials
- Growing ideas and planning for change
- Examining patterns and trends in land use, housing and population characteristics
GIS can help school districts do all of these things through the creation of powerful maps that illustrate, explain and communicate. GIS is an organized collection of computer hardware, software, geographic data and personnel designed to efficiently capture, store, update, manipulate, analyze and display all forms of geographically referenced information.
This complete computer system links information about where things are located with information about what particular data represents. Unlike a paper map where "what you see is what you get," a GIS map can combine many layers of information.
GIS has been referred to as smart mapping because users can identify feature attributes on a map just by a click of a mouse. Behind the scenes, each feature on the map is connected to a database that stores information about that feature. For instance, one can click on a school point on a map and find out the school name, address, phone number, acreage, capacity or current enrollment.
 GIS makes it easier and less costly to create highly detailed analysis and maps for planning to help plan for attendance boundary changes, future school sites, transportation routes, disaster recovery, where additional classrooms need to be built based on projected enrollment and site restrictions, where students live versus where they attend school ... the list of possibilities is extensive. The power is that one can see a broad picture of information in seconds, and it is in a form that is easily understood.
In the hands of the superintendent, the community and other District staff, these maps become very effective communication tools. They convert data, patterns, trends and difficult issues into graphic images that can bring into sharp focus new understanding about how school district services and policies are connected to the homes and neighborhoods in the community. These high-quality maps can be displayed on the District's website, used in presentations before school boards and community groups, apply for funding opportunities, and published in district newsletters, newspaper articles and promotional literature.
The demographics of our District are in constant flux. Since 2005, Broward County's long period of student enrollment growth has transitioned to declining student populations due in part to trends in the housing market and countywide demographic shifts from the No Child Left Behind program. The ability to study the spatial enrollment shifts enables District and community members to plan for ways to meet the state mandates of concurrency and class size reduction for capacity in each school. These variables require that school District planners and demographers wrestle with necessary adjustments within the District, such as individual school facilities and attendance boundaries.
Picking a site for a new school building is a very complex process involving many competing interests. Negotiating agreements and resolving conflicts with concerned parties often require "picturing" tools such as GIS maps. When municipal officials raised concerns during the Broward School District's search for a new school site, maps of student density helped to resolve the issue and get the District a desired site.

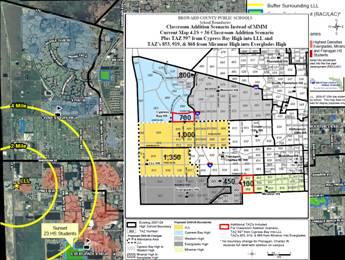
When the District decided to add a new high school, it had to figure out what the new boundaries would be. A districtwide School Board boundary process was established allowing for parents to suggest boundary alignment options. With criteria identified in policy, District staff used GIS to create colored maps depicting two options, which were then distributed to the Board and community members. Other factors such as residential certificates of occupancy, student demographics and the boundaries of existing high schools were also mapped.
With these maps, School Board and community members analyzed the advantages and disadvantages of each of the boundary options. A Web-compatible map of each option was generated with GIS software and uploaded to the District's website, along with minutes of the discussions and community feedback. Through the Internet and community meetings, parents could view the maps and follow the discussions, bringing them closer into the boundary change process resulting in over 2,300 community comments and over 40 community-driven boundary recommendations.

