- Broward County Public Schools
- Data & Surveys
Equity, Diversity and School Climate
Page Navigation
- Overview
- Calendar of Observances
- About Us
- Above the Influence
- Anti-Bullying
- Code of Conduct
- Data & Surveys
- Dating & Domestic Violence
- Diversity
- Events
- Health & Wellness
- Instructional Strategies
- LGBT
- Mentoring Across Broward
- Positive Behavior Intervention & Supports
- Positive Community Norms Marketing
- Prosocial Clubs
- Substance Abuse Prevention
- Substance Use
- Support/Response to Intervention (MTSS/RtI)
- Violence Prevention
- Youth Outer Zone (YOZ)
Data & Surveys
-
(Download Adobe Acrobat Reader to view or print PDF)

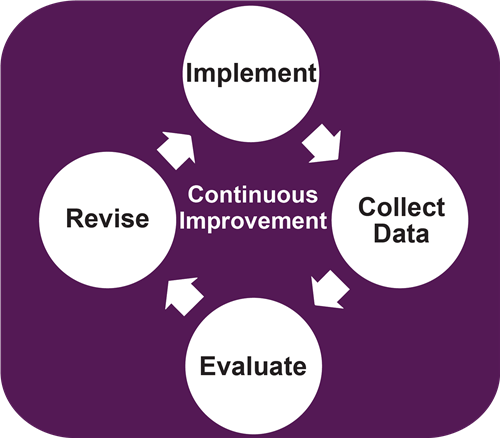
Quality data guides all the best resources and service provision. Being data driven helps to shape every step we takes in our prevention and intervention efforts. A great way to view the data analysis process is with this continuous improvement flow chart to the right.
Join us in using the below data sources to make informed decisions and to identify critical needs.
Content Accordion
-
BCPS Customer Survey
BCPS has conducted the annual Customer Survey to assess a school’s climate from the perspective of teachers, parents, and students. It was randomly administered to a significant number of students in grades 3-12, parents with students in grades K-12, and full-time instructional staff.
Please click on the link below to view the survey results:
- 2024–2025 Customer Survey
To access any other reports on a wide variety of topics that are published by the district, please visit Broward District Reports.
-
The Youth Risk Behavior Surveillance System (YRBSS)
The Youth Risk Behavior Surveillance System (YRBSS or YRBS) is administered biannually throughout the United States to a sample of middle and high school students (grades 6-12) and is designed to monitor priority health-risk behaviors that contribute to the leading causes of mortality, morbidity and social problems among youth and adults. This department helps in the administration of the BCPS survey every other year to high schools (since 1991) and to middle schools (since 2013).
View the Broward County Public Schools 2019 Youth Risk Behavior Surveillance System (YRBSS) data results: YRBS BCPS 2019 YRBS Results
The Youth Risk Behavior Surveillance System (YRBSS) monitors six categories of health-related behaviors that contribute to the leading causes of death and disability among youth and adults, including:
- Behaviors that contribute to unintentional injuries and violence
- Sexual behaviors related to unintended pregnancy and sexually transmitted diseases, including HIV infection
- Alcohol and other drug use
- Tobacco use
- Unhealthy dietary behaviors
- Inadequate physical activity
- YRBSS also measures the prevalence of obesity and asthma and other health-related behaviors plus sexual identity and sex of sexual contacts.
YRBS data from previous years:
- 2021 Broward County High School Youth Risk Behavior Survey
- 2021 Broward County Middle School Youth Risk Behavior Survey
- The YRBS Data Summary Trends Report from 2009-2019
- View the 2017 Broward County YRBS Report
- The go to the CDC website to view the 2017 YRBS results
- View the YRBS Trend Report for data from 2007-2017
- 2015 Broward Youth Risk Behavior Survey Data Report
- Broward County Public Schools YRBS 2009-2013 Booklet which includes the changes and trends found with our students.
Due to high student response rates, the results are representative of all high school students in the BCPS. Want more information? Take a look at Broward County’s results, as well as how Broward compares to both Florida and the Nation at the CDC’s Youth Risk Behavior Surveillance System webpage.
-
Florida Youth Substance Abuse Survey (FYSAS)
The Florida Youth Substance Abuse Survey (FYSAS) is administered every other year to students in grades 6-12. The survey assesses risk and protective factors for substance abuse, in addition to substance abuse prevalence. The resulting information is used to shape the face of prevention and intervention efforts.
View the FYSAS student questions
View the FYSAS results
-
BCPS Climate Survey
Beginning in 2022, an anonymous School Climate Survey will be administered to students in grades 3-12 and staff. The goal is to identify overall school climate trends and behavioral concerns. Student and faculty responses will provide guidance for intervention needs and support throughout the District. Parents wishing opt-out of the survey for their children may do so.
The survey questions can be viewed below:
If you have any questions, please contact us at 754-321-1655.
-
School Environmental Safety Incident Reporting (SESIR)
The School Environmental Safety Incident Reporting (SESIR) System currently collects data on 26 incidents of crime, violence, and disruptive behaviors that occur on school grounds, on school transportation, and at off-campus, school-sponsored events, during any 24-hour period, 365 days per year.
The current SESIR data can be found on The Code Book for Student Conduct & Discipline Matrix webpage.
-
Positive Community Norms and Social Norms Marketing
Do you know an evidence-based approach to use your data to promote protective factors, increase healthy norms, and improve healthy community behaviors? Go to the Positive Community Norms and Social Norms Marketing webpage to learn more.

